Livent Corporation is a US-based company founded in 1942 that is operating in the field of production and usage of lithium to provide sustainable energy solutions.
The company has a global reach and is providing lithium applications in various industries including:
- Energy
- Electric Vehicles
- Aerospace
- Healthcare
- Industrial Applications
LTHM is a disruptor in the lithium industry, both in production and its applications worldwide. The article aims to provide a potential snapshop into Livent Corporation’s potential for the remainder of 2023.
Forecasting involves analyzing a company’s data to project its future performance. Factors like historical and current performance, economic conditions, geopolitics, government policies, and supply chain challenges are considered.
Currently, the global economy is experiencing a slowdown due to the following factors, which make forecasting even more difficult:
- High inflationary pressure around the world
- Central banks raising interest rates globally to combat inflation
- The increase in interest rates may cause banks to fail
- The ongoing war in Europe adds to the uncertainty
- Overall uncertainty leads to concerns about crisis and recession.
Stock Forecast for 2023
The stock closed at $19.90 per share on April 6, 2023, with close to a $3.9 billion in market cap making the company a mid-cap firm.
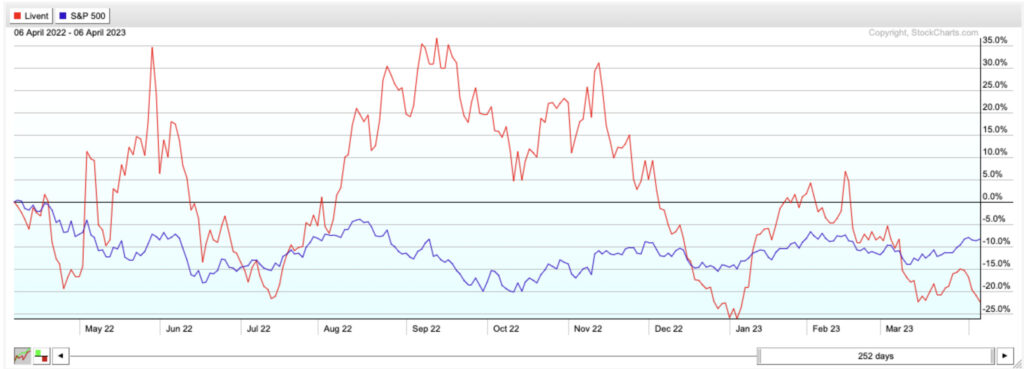
Performance of the Livent Corporation stock for the past year (~ -22%) shows that it’s underperformed the S&P 500 (~ -8%) and with more volatility as well.
The competitive landscape is broad with many players in the market given the increased demand for lithium products in recent decades. Some of the rivals of Livent Corporation are:
- Albemarle Corp. (ALB) – US-based chemical manufacturer which has a segment in the lithium field. The firm has a market cap of more than USD 26 billion
- Lithium Americas (LAC) – Canadian firm that specializes in development projects in the space of lithium with around USD 2.9 billion in market cap.
- Piedmont Lithium (PLL) – focused on the development and manufacturing of lithium-based batteries for the electric vehicle industry. This American company has a market cap of about USD 1 billion
- Sigma Lithium (SGML) – Brazilian company, with USD 4 billion market cap, is engaged in the production of lithium and is planning to scale its operations to build a lithium concentration plant.
The competitive analysis shows that there are a lot of small, medium, and big players in the lithium sector all covering different industrial uses of the product. However, Livent Corporation manages to grow in this competitive sector by diversifying its offering to multiple industries including:
- Energy
- Electric Vehicles
- Aerospace
- Healthcare
- Industrial applications
Moving to the technical analysis of the LTHM stock, we look at the past year’s historical performance and use several technical indicators to understand the current stock price level relative to the historical time series.
- Moving Average Convergence Divergence (MACD) – this indicator represents the current market sentiment regarding the stock relative to its historical movements. At the moment it indicates a reversal from a bearish sentiment to a bullish one as the overall markets try to recover with the hope of ending banking turbulence.
- Relative Strength Index (RSI) – shows whether the current price relative to its historical performance is relatively overvalued or undervalued with the main assumption being meant reversion of the stock prices which states that the stocks tend to converge to their average price over time. With the current level of the stock price, this indicator suggests that the price is fairly valued with some upward trend due to recent bullish moves.
- Bollinger Bands (BB) – shows boundaries around the current price levels which indicate whether the price is at its highest or lowest relative to the historical movements. It is also based on the key assumption of mean reversion. Similar to RSI this indicator also reflects the fact that the stock is fairly valued close to its average with a slight upward bias.
Overall, the technical analysis suggests that the stock is currently in line with its fair value, and there is some upward bias due to the market rebound. It is worth noting that technical analysis and the indicators discussed are based on historical trends and assume mean reversion, which may not hold true due to various market factors and uncertainties.
While technical analysis tries to forecast the short-term performance of the stock, fundamental analysis tries to find the intrinsic value of the stock. This is then the base for forecasting the long-term convergence of the stock price to its intrinsic value.
For that reason, we will look at several financial ratios of the company to analyze the trend of the company’s financials and understand the overall financial health of the firm. Thus starting with the profitability ratios such as Return on Assets (ROA) and Net Margin we see that since 2019 even though there was a slowdown caused by COVID-19 the company managed to bring back its profitability and increase to new highs.
| 2019 | 2022 | |
| ROA | 6.6% | 16.7% |
| Net Margin | 12.9% | 37.7% |
Other ratios that are closely monitored to get some idea about the financial health of the company are the liquidity and leverage ratios such as Current Ratio and Debt to Asset Ratio, respectively. Since 2019 the Livent Corporation has managed to increase its liquidity ratio which means it is better positioned to meet its short-term financial obligations with its current assets while at the same time, the firm has managed to reduce the Debt to Assets Ratio that is again positioning the firm better when considering the rising borrowing costs.
| 2019 | 2022 | |
| Current Ratio | 222% | 366% |
| Debt to Assets Ratio | 20% | 12% |
Finally, we look at the valuation ratios to understand the trend of the firm’s value vs its financials such as the Price to Sales Ratio and the Price to Cash Flow Ratio. These show a diverging trend since the company value increased based on the Price to Sales ratio since 2019 while the Price to Cash Flow Ratio shows a decrease in the multiplier. This is largely driven because of higher operating cash flow for 2022 caused by higher income.
| 2019 | 2022 | |
| Price to Sales Ratio | 3.2 | 4.9 |
| Price to Cash Flow Ratio | 21.5 | 8.8 |
Overall the firm has been on an upward trend since 2019 from all aspects of its financial statements making its financial health even more robust after the decline in 2020 due to the slowdown from the pandemic. Furthermore, in most of the years, it surpassed the earnings expectations with the upward trend and is expected to do so for 2023 besides the global economic slowdown. This is largely driven by the emerging use of lithium products in particular in the energy and eclectic industries which is going to increase the financial further fueling the stock price.
Overall, both the outlook for Livent Corporation in 2023 appear trending positively based on technical and fundamental analyses. This sentiment is echoed by analysts who cover the stock.
Currently, 15 analysts offer 12-month price forecasts for Livent Corp. Their median target for the stock is $30.00, with a high estimate of $45.00 and a low estimate of $23.00. This median estimate represents a 50.25% increase from Livent Corp’s closing price of $19.90 on April 6, 2023, while the high estimate represents a 126.13% increase and the low estimate represents a 15.08% increase.
Conclusion
Livent Corporation specializes in lithium product applications across various industries, such as energy, electric vehicles, and industrial applications, among others. The company is showing positive trends both in its financials and technical indicators, which is a good sign for its potential in 2023, assuming no significant setbacks occur. Most of the analysts covering the stock appear to agree with this favorable outlook.
FAQ
Given the high demand for lithium products and increasing application in various industries, LTHM saw an increase in its financials and hence better financial position.
It is used in industries such as energy, electric vehicles, aerospace, healthcare/pharma, and industrial application.
Overall there is high competition in the market with large, mid, and small players, the company is growing its footnote but at the moment it is a mid-sized firm.
StockHax strives to provide unbiased and reliable information on cryptocurrency, finance, trading, and stocks. However, we cannot provide financial advice and urge users to do their own research and due diligence.
Read More