. Delve into the methodology and practical applications of this analytical tool.)
This website and its content are not intended to provide professional or financial advice. The views expressed here are based solely on the writer’s opinion, research, and personal experience, and should not be taken as factual information. The author is not a financial advisor and lacks relevant certifications in that regard. We highly recommend consulting a qualified financial advisor before making any investment decisions, as the information presented on this site is general in nature and may not be tailored to individual needs or circumstances.
Trading on the stock exchange has always been a risky and complex activity, with which only a very limited number of people have been successful. The main risk of trading comes from the volatility of the market and the fact that it is inherently unpredictable, especially in the short term. But what if we could use this volatility as a building block for a sound trading strategy?
Ultimately, volatility is not only what could make a trade unprofitable, but also the aspect that could help us make profits. Depending on the financial instruments we want to trade, volatility can change significantly. For example, cryptocurrencies and options have much higher volatility than stocks and commodities.
There are many different indicators that can be used to measure the volatility of a particular financial instrument, but two of the most common are undoubtedly the Average True Range (ATR) and Implied Volatility (IV).
Implied Volatility is mainly used for options trading and is often referred to as a proxy for the standard deviation of the price, which is also considered as market risk. On the other hand, Average True Range is a dollar amount based on the intraday price movement of a financial instrument.
In this article, we will focus on what the Average True Range is, how it is calculated and how it can be used in a trading strategy.
What is the Average True Range (ATR)?
The Average True Range, as the name implies, is the simple moving average of the “true range” of a stock’s price over a given period of time, which is usually 14 days.
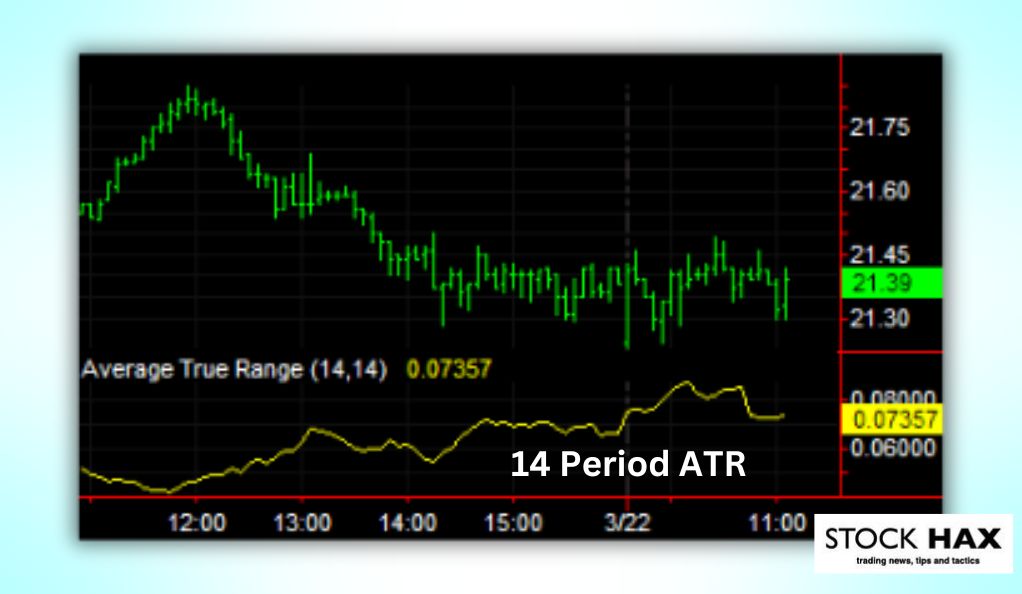
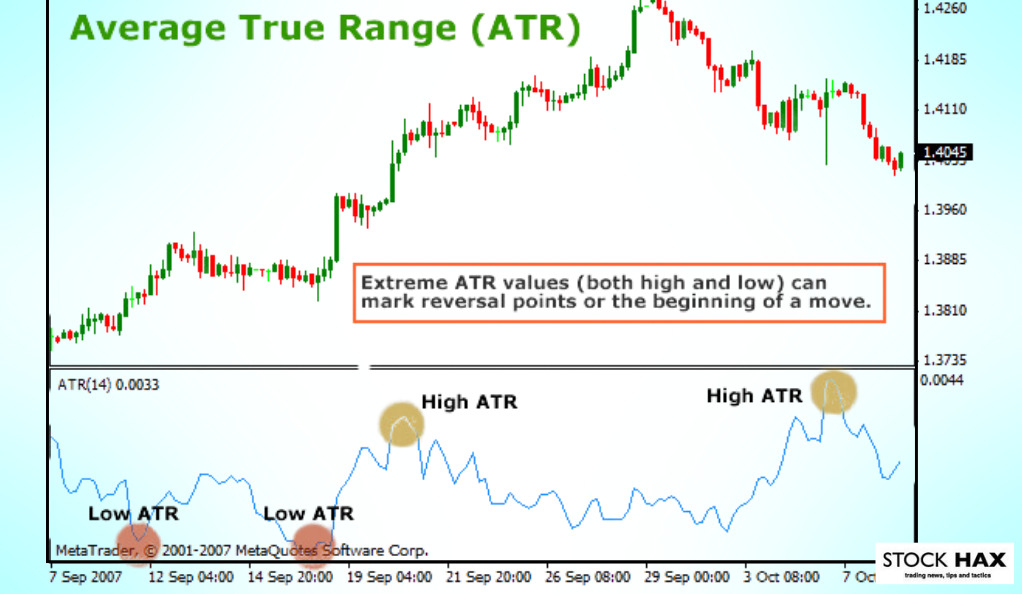
Observing the average true range over a long period of time and plotting it on a line chart can be extremely helpful for traders to anticipate a possible price reversal. Therefore, many trading strategies involve looking for divergences between stock price directions and the ATR direction.
For example, in many cases where a stock’s price is moving sideways and heading towards strong resistance, the Average True Range usually begins to trend upward, indicating an impending increase in volatility and possibly either a strong breakout or rejection.
How is the ATR calculated?
To calculate the average true range, you must first determine the true range, which is the highest dollar fluctuation in the price of a stock in a trading period. More precisely, the true range is defined as the highest result of the following three calculations:
- Current High minus Current Low
- Absolute value of the current high minus the previous closing price
- Absolute value of the current low minus the previous closing price
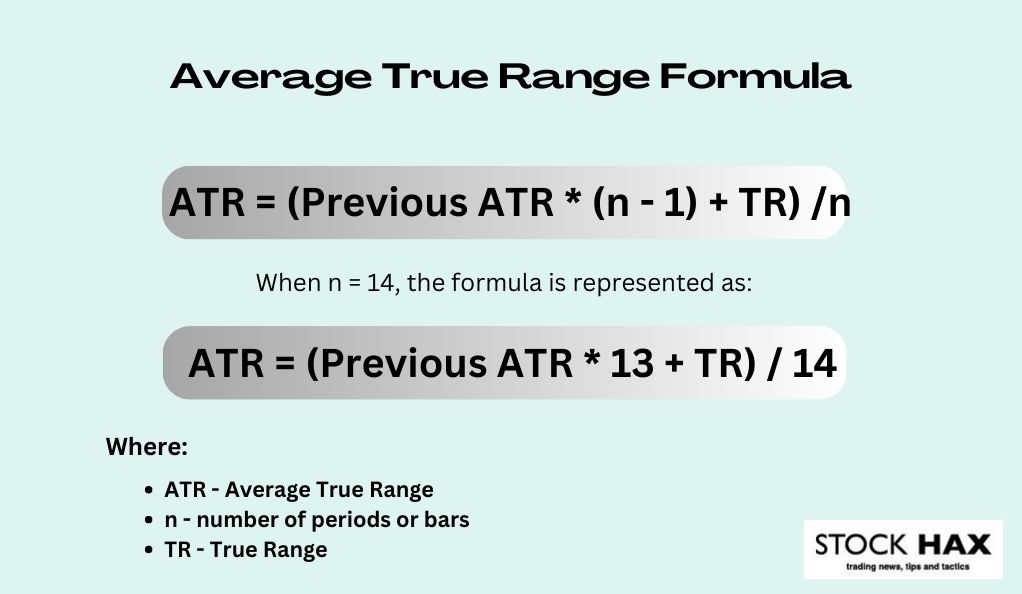
So to find the true range for each trading day, you need to do these three calculations and take the one that gives the highest result. Then to find the ATR, we just need to take the true range for each of the last 14 trading days and calculate the simple average by adding up all the true ranges and dividing by 14.
On the next trading day, we then need to calculate the true range for that trading session, add it to the previous ATR multiplied by 13, and divide the sum by 14. This process is equivalent to summing the true ranges of the previous 13 days and adding today’s true ranges to then calculate the average.
How Can the Average True Range be Useful when Looking for a Trade
The Average True Range is an extremely useful indicator because it is important not only when performing a technical analysis, but at all steps of trading. Namely, the ATR can be used for screening stocks, technical analysis, setting an order, closing a position, and more.
For stock screening in particular, it can have an important function in helping traders find profitable trades. Stock screening is all about locating specific stocks that offer a good opportunity to open a trade.
Considering that there are more than 6000 companies listed on the NYSE and Nasdaq, and that it is impossible to check them all every day to see if there is an opportunity, stock screeners are necessary. Depending on the stock screener, it is possible to apply many different filters, including chart patterns, candlestick patterns, interactions with Simple Moving Averages (SMA), RSI values and much more.
How to use the ATR Indicator in Stock Screening
Among the most useful filters are those related to the liquidity, market capitalization and volatility of a stock. It is always important to specify these three parameters according to the type of stock you are looking for.
This is because the shares of companies with a very low market capitalization are usually very illiquid, which leads to price gaps and low intraday volatility, difficulties in opening and closing a position, the impossibility of short selling and more.
Similarly, the average true range is very useful if we remember that it represents the average daily price movement. While it is true that high volatility in trading can hurt profitability, but if the price of a stock hardly moves, the trader will either have to buy a large number of shares or wait a long time before securing a nice profit.
Thus, if we filter out stocks whose ATR is below a certain value, which depends on personal preferences and the trading strategy, we can be sure that we are excluding companies whose price does not fluctuate enough to make potentially profitable trading possible. This result could not be achieved by using a market capitalization filter alone, as even very large companies can have a very stable share price and thus very low volatility.
How to use the ATR together with other Indicators When Analyzing a Potential Trade
On the other hand, no matter how great and useful the Average True Range indicator is, it is always important in trading to find a set of indicators that point in the same direction. Since technical indicators can often lead to wrong results, traders often refer to technical analysis as “cluster analysis”.
Cluster analysis is about finding a “cluster” of technical indicators that point in the same direction. Even if some of them give wrong results, there is a high probability that the trade could be profitable.
Also, it is important to use indicators of different categories in a cluster analysis. For example, a good habit would be to use a few momentum indicators, a few strength indicators, a few volatility indicators and a few mean reversion indicators.
Usually, the most commonly used indicators in each category are the Moving Average Convergence Divergence and the Parabolic SAR for the momentum indicators, the Relative Strength Index and the Elders’ Force Index for the strength indicators, the ATR and the Implied Volatility for the volatility analysis, and finally the Bollinger Bands and the Percent Distance to Moving Average.
However, these are only a few indicators per category and the decision on which indicator to use is highly subjective and depends on the trader’s preferences. Therefore, it is best to try the indicators yourself and then decide which ones are the best.
Finally, in technical analysis, it is also important to pay attention to the chart pattern, support and resistance lines, and candlestick patterns in order to have a greater probability of success.
Trading Strategies Using the ATR Indicator
Thanks to all the technical indicators mentioned above, it is possible to identify many different trading strategies when looking at a stock chart.
For example, if the stock price is moving sideways towards a strong resistance, the average true range is increasing, but the strength indicators show that the energy of the movement is decreasing, then this could be a great opportunity to open a short position if the price is also overvalued.
On the other hand, if the strength indicators in the above scenario show a strong upward movement, then all these signals point to a breakout and possibly even a short squeeze if the movement is strong enough.
A short squeeze is a strong and extremely fast upward movement after the price of a stock has broken through a strong resistance zone. These phenomena occur because when the price continues to rise, all the stop losses of investors who have taken a short position are triggered and a vicious cycle of buy orders begins.
Similarly, there are hundreds of trading strategies based on the same properties of ATR and other indicators, designed to make profits in the market. However, it is not necessary to know and understand them all, because often it is enough to know the basics and master a few strategies to be successful in the market.
Opening a Position using the Average True Range
Finally, the usefulness of Average True Range does not stop at technical analysis. The ATR can be helpful in determining important aspects of a position, such as where to place the opening and closing orders.
Especially when opening a position, it is a good habit not to place market buy orders at the current price, as there is always a fear that the momentum will not continue in the following trading sessions. For this reason, traders usually place a stop limit order a few cents above the previous closing price to ensure that the trade is triggered only if the momentum continues.
However, the distance between the closing price and the stop limit order depends on personal preferences and trading strategies. Many choose to set the order price 5-10 cents above the previous day’s high. Many other traders, however, use the Average True Range and set the order price 1 ATR above the previous close.
Closing a Position Using the Average True Range
The same modus operandi is applied when deciding where to place the stop loss. Generally, the stop loss for a long position is placed either below the last swing low or below a strong support. But even in this case, it depends on the trader’s preference how much lower he places the stop loss, and he usually chooses one of the two methods we talked about before.
However, when we talk about the stop loss, it is important to mention the case of a trailing stop loss as well. This stop loss is a special type of order that follows the price movement when the trade is going in the right direction, but stops when the price moves towards the stop loss instead.
The usefulness of this stop order is highly debatable, as in many cases it can help avoid a loss if the trade initially moves in the expected direction and then starts to fall earlier than expected. On the other hand, in many cases it can cause the position to be closed after a short pullback before it continues to rise if the stop loss is too close to the price.
So using a trailing stop loss can be tricky, and its usefulness depends entirely on the trailing loss setting the user has chosen. Often, the trailing stop loss is set at a distance equal to a multiple of the stock’s ATR to ensure that, on average, a negative day will not trigger the stop loss.
Conclusion
In summary, the Average True Range is an extremely simple indicator, but at the same time it is equally useful in many aspects of trading. It is calculated as a simple average of the true range of the last 14 trading days and represents the average daily movement of the stock.
Unlike other volatility measures, such as implied volatility, it is nominal, meaning it is measured as a dollar amount, with no mention of percentages or standard deviations. Because of this simplicity, ATR has become extremely popular in many aspects of trading, from research to closing a position.
For example, it can be used as a criterion in stock screening process to avoid stocks that are illiquid and have very low intraday volatility, resulting in slow trading. In addition, ATR is often used to set stop losses, especially trailing stop losses, as a gap of more than 1 ATR between the stop loss and the opening price ensures that a bad day on average will not trigger the stop loss.
So if you are someone who is starting to trade, you should definitely take a look at this interesting indicator. And if you are looking for more information or tips and tricks about trading, be sure to check out or website!
FAQ
The average true range shows, on average, how by how much the stock price fluctuates in a day. So, if the average true range of a stock is $1, it means that on average the distance between the high and the low of a stock is $1. However, this does not necessarily mean that the difference between closing prices at the end of the day will be one dollar.
Because the average true range is an average amount and because it is measured on a relatively small timeframe of 14 days, it could be the case that in some cases a trading session’s true range is significantly different from the ATR. However, rather than being false readings, these situations could better be explained as instances in which the ATR does not closely represent the volatility of the stock.
The Average True Range serves so many purposes in trading that even if a trader does not directly use it, it could still be helpful to understand its functioning to trade more proficiently. However, it is important to remember that no indicator should be used by itself, so even if the ATR is added to a trader’s toolkit, it is still necessary to perform the technical analysis with other types of indicators.
StockHax strives to provide unbiased and reliable information on cryptocurrency, finance, trading, and stocks. However, we cannot provide financial advice and urge users to do their own research and due diligence.
Read More